These Sensors can be used to measure distances and heights. A wide variety of models is available, including Laser Sensors, LED Sensors, Ultrasonic Sensors, Contact Sensors, Eddy Current Sensors, and more.
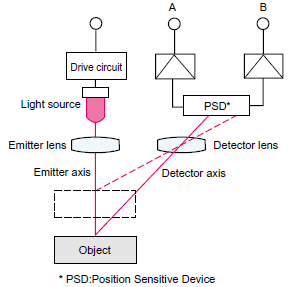
Light from the light source is condensed by the lens and directed onto the object. Light reflected from the object is condensed onto a one-dimensional position sensing device (PSD)* by the receiving lens. If the position of the object (the distance to the measuring device) changes, the image formation positions on the PSD will differ, and if the balance of the two PSD outputs changes, the image formation positions on the PSD will differ and the balance of the two PSD outputs changes.
If the two outputs are A and B, calculate A/(A + B) and use appropriate values for the span coefficient "k" and the offset "C".

The value measured is not the illuminance (brightness), but the two output displacements A and B, and thus even if the received light intensity changes because the distance to the object changes, the result is not affected and linear output proportional to the distance difference and position shift is obtained.
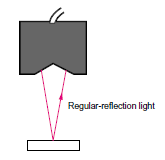
Light from the object is directly received by regular reflection, and stable measurement is possible of metal and other objects with a glossy surface.
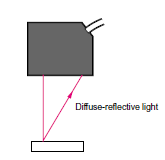
A light beam is projected perpendicularly onto the surface of the object, and the diffuse light that is reflected back is received for a wide measurement area.
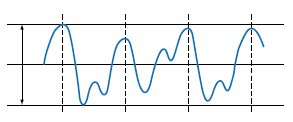
This is the width, expressed in terms of the distance, of the fluctuation in the linear output when the measured object is still.
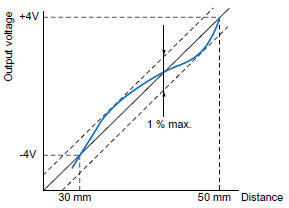
Error with respect to ideal straight line of linear output Normally the percentage of the measurement range (full scale: FS), expressed in the format "1%".
The amount of variation of linear output with respect to changes in the ambient temperature. Normally the percentage of the measurement range (full scale: FS), expressed in the format []%FS/°C.
Example: 0.03%FS/°C (FS = 20 mm)
Linear output when the displacement and width of the object are changed to steps. In analog output, the time required for 10% to 90% change is expressed in terms of the "response time".
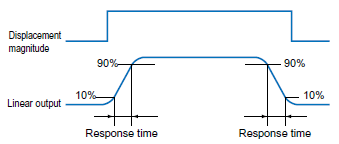
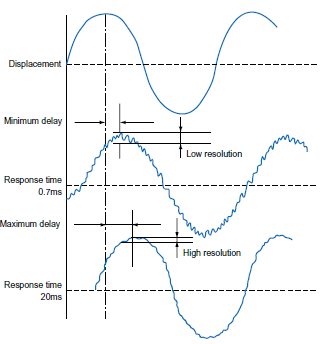
In general the displacement, response time, and resolution are correlated as shown in the following diagram.
